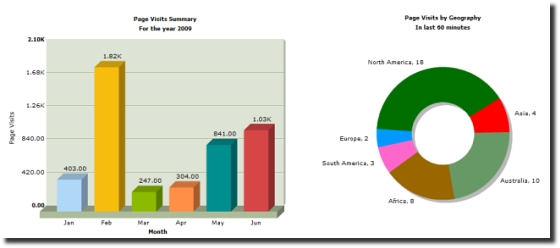
In this article I will show you, how to create cool self-updating charts using Fusion Charts , ASP.NET and some AJAX. If you are getting impatient to see how they look, click here to see a demo. You should read this article if :
- You want to integrated animated charts into your ASP.NET pages.
- You are looking for free and feature rich charting tool.
See Live Demo | Download Source
About Fusion Charts
Fusion Charts is a flash based charting package that can be used with almost any server side programming language. The free version of their charts includes some 22 different types of charts which can be animated. The best part of the free version is,it comes with unbelievably liberal license agreement, which allows you to use them even in your commercial applications. You can read the license for free version here: http://www.fusioncharts.com/free/TermsOfUse.asp .
Downloading and Installing Fusion Charts
- Download ‘Fusion Charts Free’ from this link. Before downloading please read the terms of use.
- Download my source code and unzip to a folder, say C:\…\SelfUpdatingCharts\
- Open the C:\…\SelfUpdatingCharts\ folder as a website in VS 2008 or VWD 2008.
- Unzip the fusion charts zip file and copy contents of ‘Charts’ folder (all *.swf files) to C:\SelfUpdatingCharts\Charts folder.
- Copy the FusionCharts.js file from C:\..\..\FusionChartsFree\JSClass folder to C:\SelfUpdatingCharts.
After performing the above steps your solution explorer would look like attached image.
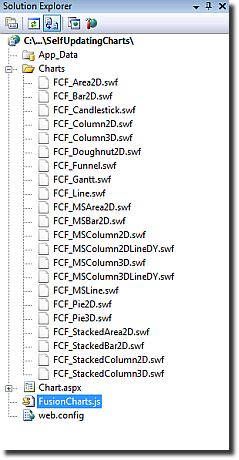
Thats it! we are all set up. After this step you should be able to run the Charts.aspx file and see the charts in action. In the remaining part of article, I will discuss step by step how to include charts in a newly created page.
Creating a new *.aspx Page
Create a new *.aspx page. Add a script manager to it. Make sure that the ‘EnablePageMethods’ property is set to ‘true’.This is required, since we will be using WebMethods via AJAX to fetch data for our graph at regular interval.Now add a reference to the FusionCharts.js file in our new aspx page. Somewhere on the page create a DIV tag and assign it an id of “mychart”. We will use Fusion Chart’s javascript API to create and display a new bar chart inside this div.
Writing server side code
I am going to create a six data point bar chart. So we write a “WebMethod” in the code behind ,which returns an array of six numbers. The code is simple:
[] |
The code is pretty straightforward, except for the ‘IsDataChanged’ and ‘Session’ part. The first one is a function that in real world scenario would hit database and check if there are any changes. If no changes were recorded after last request, it would return “NULL” instead of returning data. In this way I have tried to preserve bandwidth and prevent the charts from updating unnecessarily. The code involving session object makes sure that data is always transmitted for the very first time. There can be various ways of achieving this, this is my method.
Writing the javascript
The javascript for chart can be divided into three parts. The first one creates the chart object, second one does AJAX to get new data and last one generates XML required for binding to the data returned by server. One thing I want to tell here is, you can directly return XML from the server, instead of CSV. I used CSV, because I felt it was lighter and XML generation could be handled at the client end using javascript. Given below is the code:
<script type="text/javascript" src="FusionCharts.js"></script> |
The first function, ‘init’ is called on the ‘onload’ event of body. It creates a new ‘Chart’ object by specifying the path of swf file ,id of the chart and its dimension. The ‘FCF_Column3D.swf’ file creates a 3D bar chart for us. Immediately after creating the chart we assign it empty XML and make an AJAX request using PageMethods object. When the response of our request arrives, ‘OnCompleteBarChart’ gets called, which in turn calls ‘GenerateXMLForBarChart’ and updates the bar chart display. One important thing to note here is that the format of XML varies depending upon the chart type. You can have a good idea of the XML for various chart types by checking examples provided with Fusion Charts. The ‘GenerateXMLForBarChart’ method takes a CSV string returned by server and transforms it into XML required for the graph.
Thats all!
Now run the page, you should be able to see the chart. In my code, I have specified a timeout of 10500 ms between two AJAX calls for updating the chart. This should be sufficiently high, other wise the chart would refresh before. Thanks for reading. Hope you found it useful. For suggestions,questions or criticism , please drop a comment.