This article explains creation of simple AJAX based graph using HTML elements. To actually see it in action download the zip archive and run the demos.
Downloading and Viewing the demos
- Download the code
- Using Visual Studio 2005 , create a new ATLAS (ASP.NET AJAX) project. If you don’t have ASP.NET AJAX installed, get it from here.
- Extract and add ALL the contents of graph.zip to newly created project.
- All the files should be at same level as Default.aspx of new project.
- Set AJAXGraph1.aspx as start page and run the project.
Creating new ASP.NET AJAX website.
Here I assume that you have ASP.NET AJAX (previously ATLAS) installed. You should be able to open your IDE and simply create a new “Atlas” website. This should open a new project with Default.aspx. This is the file you should be using. Make sure it has this tag:
<atlas:ScriptManager ID="ScriptManager1" runat="server" /> |
Writing the server side method
In the code-behind file ‘Default.aspx.cs’ , we write a new web-method for use in AJAX. This method merely returns a random integer. In real life application, it would query some database and retrieve the result. I have put a random delay to simulate processing and network delay. Make sure you include the ‘System.Web.Services’ namespace.
using System.Web.Services; |
HTML required for Graph
The graph is basically a table with multiple columns. Every column has a
<table class="gridTable"> |
There should be as many
Add the magic Javascript
Download my AJAX graph javascript from here. Add reference of this script file in Default.aspx
<script type="text/javascript" src=AJAXGraph.js></script> |
Once this is done time to write your own javascript. This section is important. Most of the time copy paste might work , but at times you will want to implement your own custom behavior. Add the following javascript just after the above above script line, before the <body> tag:
<script language="javascript"> |
There are a few important things to explain here. First , notice the long list of parameters (d1..d16) being passed while constructing a new AJAXGraph object. This is actually list of the
<body onload="init()"> |
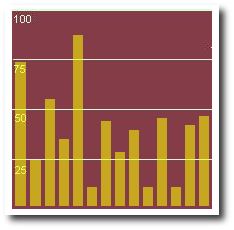
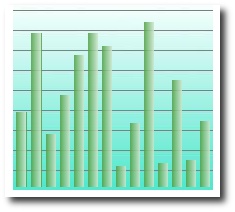
The PageMethods object houses javascript functions for every ‘WebMethod’ defined in code behind. So, PageMethods.GetNextValue(OnComplete,null) will execute the ‘GetNextValue’ method on server. The ‘OnComplete’ function acts like a callback function for AJAX request. When a response is received , it gets called. Call to ‘mygraph.PlotValue’ will automatically plot the new value received from server onto the graph. Note that the value returned from server should not be greater than the height of table itself. The value actually represents height in pixels of a bar in the graph. You should ideally process value returned form server so that it is under required limit. Also note that server method only returns an integer, so consumes less network bandwidth. You can vary the speed at which the graph refreshes by varying the second parameter in the call to window.setTimeout, in the ‘OnComplete()’ function. For more clearer picture, you can always refer to the source of downloaded files. Just by changing the CSS classes you can create some stunning looking UI. Check out the screenshots below.
Hope you found this article interesting. As always, mail me your suggestions and questions.
About Me


Read my book :